By: Richard W. Sharp

Software architectural diagram of netflixable.com’s Netflix data storage system.
Collecting a historical dataset of the movies available for streaming on Netflix sounded like a straightforward project, but turned into a tangled mess of data spread across different sites and presented in multiple formats. But here we are, after a couple weeks slogging away in the data mines, with a new data set chronicling trends in the streaming service’s catalog going back to 2012.
And there are a few gems to show for it: the collection is shrinking, though there’s some indication that quality is up and variety is increasing.
The short-short version
The Netflix collection is shrinking (significantly), though average ratings of the titles in the catalog have gone up (a bit). Some genres are becoming less common (drama) while others are adding titles (comedy and documentary).
The methodology
We outlined the approach in the Niche teaser trailer: combine historical lists of streaming content from netflixable.com with genre data from OMDb. The main challenge was to handle several format changes at netflixable. The most serious of these was the switch from Netflix movie IDs to a couple of different internal ID schemes.
So what? Well suppose we’re talking about The Fly. Wait, was that the 1958 original (with Vincent Price!), Jeff Goldblum’s landmark 1986 remake, the 1989 sequel, the 2013 short about a getaway driver, or the 2015 superhero flick? Having a unique ID for each movie is essential, but if that ID number changes then we suddenly start to count the same movie as two or more distinct films. Fortunately, netflixable provides titles and release years, which were used to track down duplicates.
Another challenge was to distinguish between movies and series. In many cases the netflixable data gives some clues, e.g., listing a number of seasons instead of a runtime, adding “Season 1” or “Series 2” to the title, or listing a range of years for the release date. Even so, a number of series snuck past this first line of defense. Luckily, the OMDb data sometimes contains a “series” or “movie” type, and this was applied if present to further refine the list. In the end, we collected 22,198 unique movie titles over the last five years and retrieved genre information for 13,844 of them from OMDb.
What a tangled web we weave. Nevertheless, we’re lucky to have sites like netflixable at all since Netflix shuttered their public API. And despite all the data munging, some signals survive.
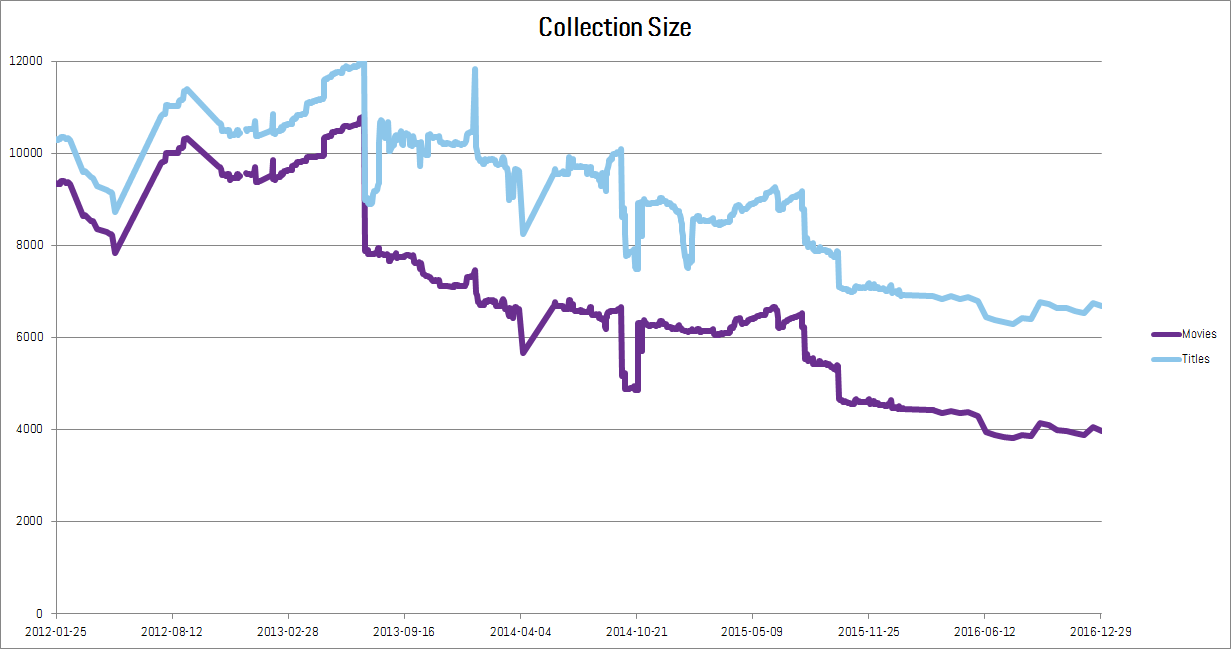
Finding 1: The Netflix streaming collection is shrinking
We’re not the first to have noticed this. A recent article in Time notes that the number of movies dropped from 6,494 in January 2014 to 4,335 in March 2016 (down 33%). Our numbers are slightly higher, but record a similar drop from 7,172 in January 2014 to 4,426 in March 2016 (down 38%). The rate of decline has stayed roughly the same since (the drop is about 38% between December 2014 and December 2016).
The Time article notes that this reduction in the number of titles is presumed to be part of Netflix’s strategy to turn away from licensing external content and instead spend that money to create their own material. The numbers also provide nice confirmation that our data is largely on-track. It’s not too surprising that the movie counts don’t match exactly because it turns out to be difficult to decide what’s a movie and what’s a series. For example, Nova is a series of stand-alone long duration pieces, so it straddles the clear divide between sitcoms and feature films. Our method seems to be more generous with the idea of a movie than Time’s, but the two data sets are close and back each other up.
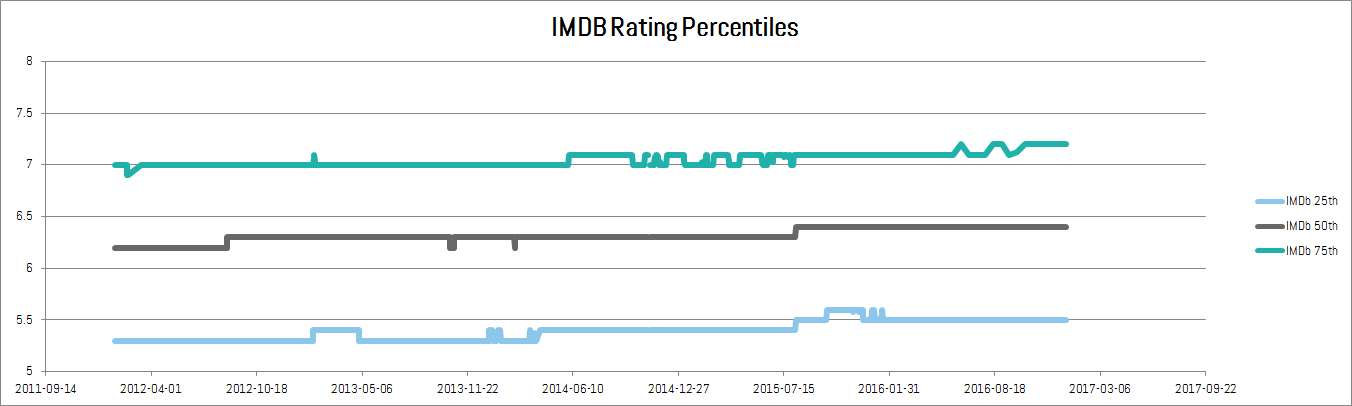
Finding 2: Quality is on the rise
One of the nice features of the OMDb data is that it includes IMDb ratings and vote totals. The distribution of these values on any given day gives us an indication of the quality of the Netflix collection. Interestingly, it seems that even as the number of movies has decreased, the distribution of IMDb ratings has shifted slightly higher as shown in the chart below.
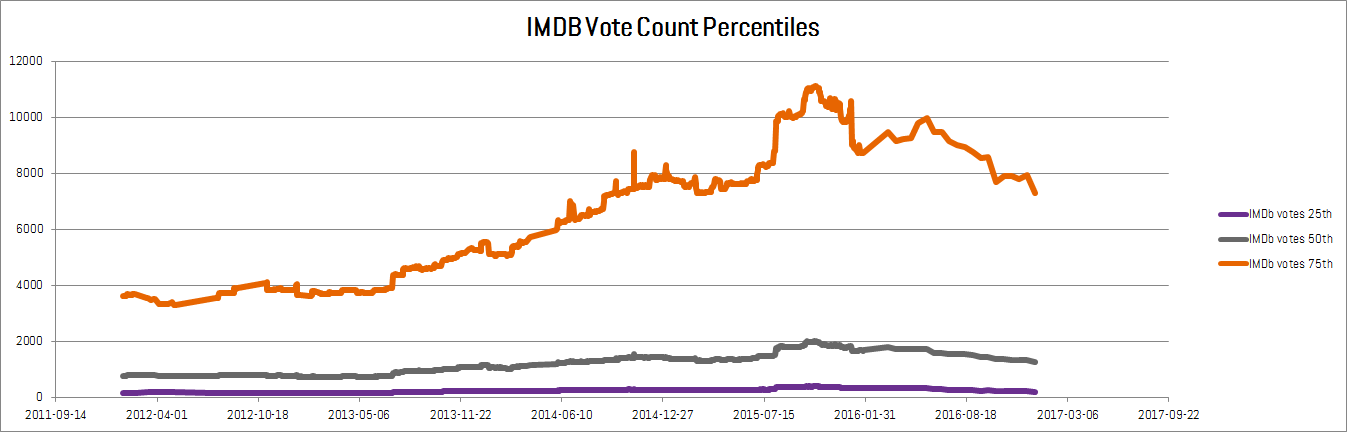
In addition, the number of votes received on IMDb for more recent movies is quite a bit more than it has been in the past. Although you might expect that better movies get more attention, it’s interesting that the movies in the collection are garnering more interest from the public. Also note that since not all movies in our dataset were matched to IMDb ratings, these observations depend on the assumption that the quality of the unrated movies is similar to the rated ones.
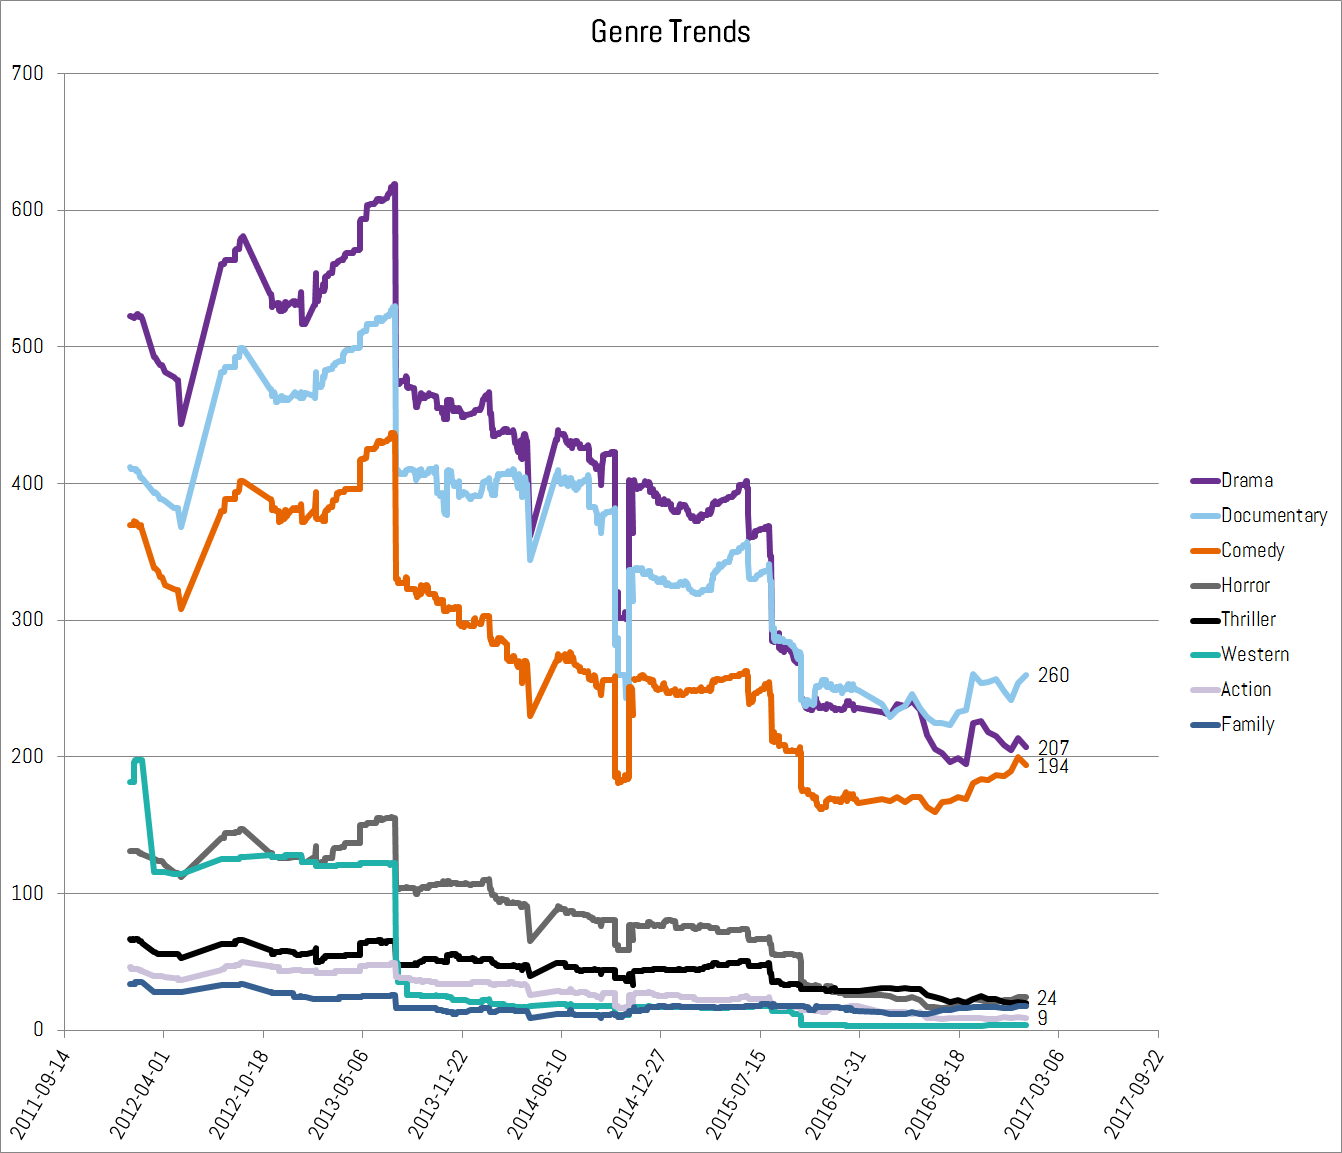
Finding 3: Dramas are down, documentaries and comedies are up
We went after this data set because we wanted to show that the on-demand, customizable nature of the internet could support special interest communities that a scheduled, geographically similar audience would not. The thinking was that if Netflix was promoting an intense, niche-centric viewership, then the rise of certain genres might reveal the shift.
At first glance we do see such a trend here. The chart below shows that the tried and true “Drama” category is down, while the “there’s something for everyone” categories “Documentary” and “Comedy” are up. Again, this observation comes with the assumption that the unclassified movies are similarly distributed. Another caveat is that many movies are listed as being parts of several categories, for example, the fan-favorite “Horror, Romance, Sci-Fi” flick of 1944: Return of the Ape Man (never thaw out bodies frozen in ice, never, never, never). We’ll need to make some sense of these cross-listed films to figure out if something’s bubbling up from the black lagoon, or if it’s just swamp gas.
What’s next?
And so, the saga continues. The next step is to take some more passes over the data set.
- Are the unlabeled movies randomly distributed?
- What sense can be made of the multi-genre movies?
- Can we make use of the series data?
Tune in next time to find out.
No Comments on "Revenge of the Niche part 2: Netflix streaming data 2012-2016"