
By: Patrick Zimmerman
Football is a simple game; 22 men chase a ball for 90 minutes and, at the end, the Germans win.
— Gary “Nostradamus” Lineker, after England lost to Germany on penalties at Italia ’90.1
The short-short-short version:
Uruguay. Next question!
Ok, fine, who else, and by how much?
The question
Can historic performance relative to player pool predict the games at next month’s World Cup?
The high number of players and teams to keep track of and the relatively long wait between international matches makes soccer fans (like all sport and political junkies everywhere, always) tend to rely on mental models that put too much weight on essentialist preconceptions of each squad. An overreliance on past performance and vague notions of a national playing “style”2 tend to substitute themselves for empirical evidence in our brains when the field is just too large for us to actually set our expectations based on current (or recent) results. Some teams will be consistently overrated because of glories long past that have little relevance to the current era.
But just because people over-emphasize something doesn’t mean that it’s not still meaningful. Soccer is clearly not just a game of numbers; there are teams that consistently qualify and win world cups with a tiny pool of players to draw from (let’s not talk about the USMNT choking away World Cup 2018 qualification by losing at Trinidad. Too soon.). Above a certain size (leaving out teams like San Marino, Andorra, or Guam), it’s pretty clearly not as simple as “big countries tend to have better teams than small ones.” Uruguay (according to FIFA) has roughly 3% of the number of players to draw from as Mexico. One of those two countries has two World Cup titles, two 4th place finishes, and a winning record all-time at the sporting event watched by a shade under half the world population (in 2014). The other is el Tri , which has never made it past the quarters (and then only as hosts, twice).
So, is it possible to incorporate historical performance vis-à-vis demographics into a modern predictions model? And how badly would this beat the pants off the FIFA rankings?
Challenge accepted.
What countries do more with less?
There are some small countries that surprisingly do very well at World Cups, and some large ones that have very ‘meh’ results. And, to make the comparison fair, I’m going to define country size by player pool, not raw population. So while Germany has roughly 60% of the population of Russia (~80M v. ~140M), it has almost 3x the number of registered male soccer players (~14.4M v 5.1M). Thus, the Germans have a lot more potential players to choose from when selecting a 23-man squad than the Russians do.
I am using the absolute number of players, rather than players/total population because, while the latter is an excellent way to measure interest or enthusiasm in a sport (to answer, for example, is soccer more popular in the USA or in Uruguay), or perhaps domestic team / league strength, it’s not the best way to think about the World Cup. International tournaments mean that each and every country gets to pick one and only one set of 23 players, so the Germans really do have an advantage in absolute terms, making their (excellent) World Cup record not that surprising. The Germans are very good, but they have not really outperformed what one would expect given their built-in player pool advantage.
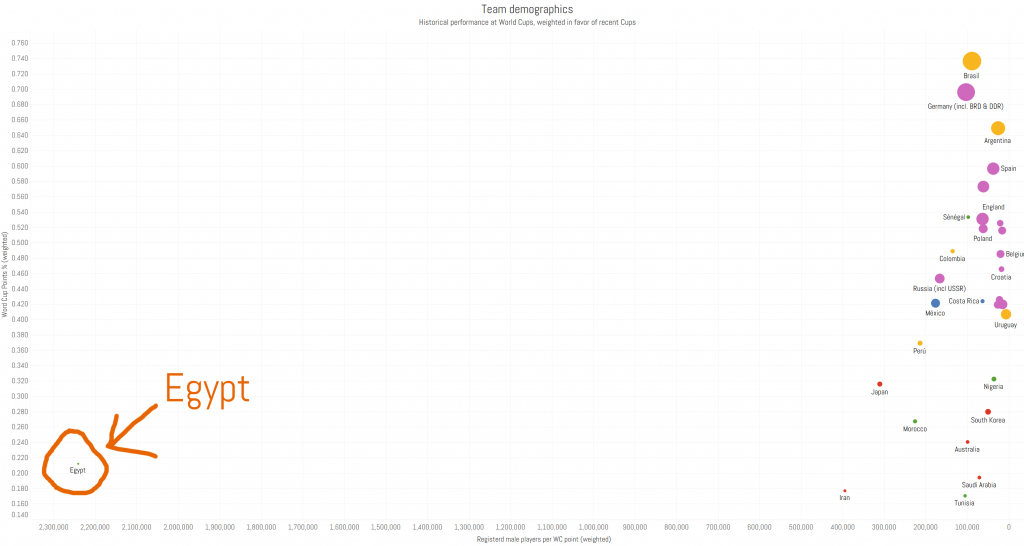
How does each team rank? We took each team’s available player pool (in 2006) and then simply divided by the total World Cup points earned (weighted so more recent cups count more).
Mouseover for details.
Yes, Egypt is so bad it made me use a logarithmic x-axis in order to see the rest of the chart.
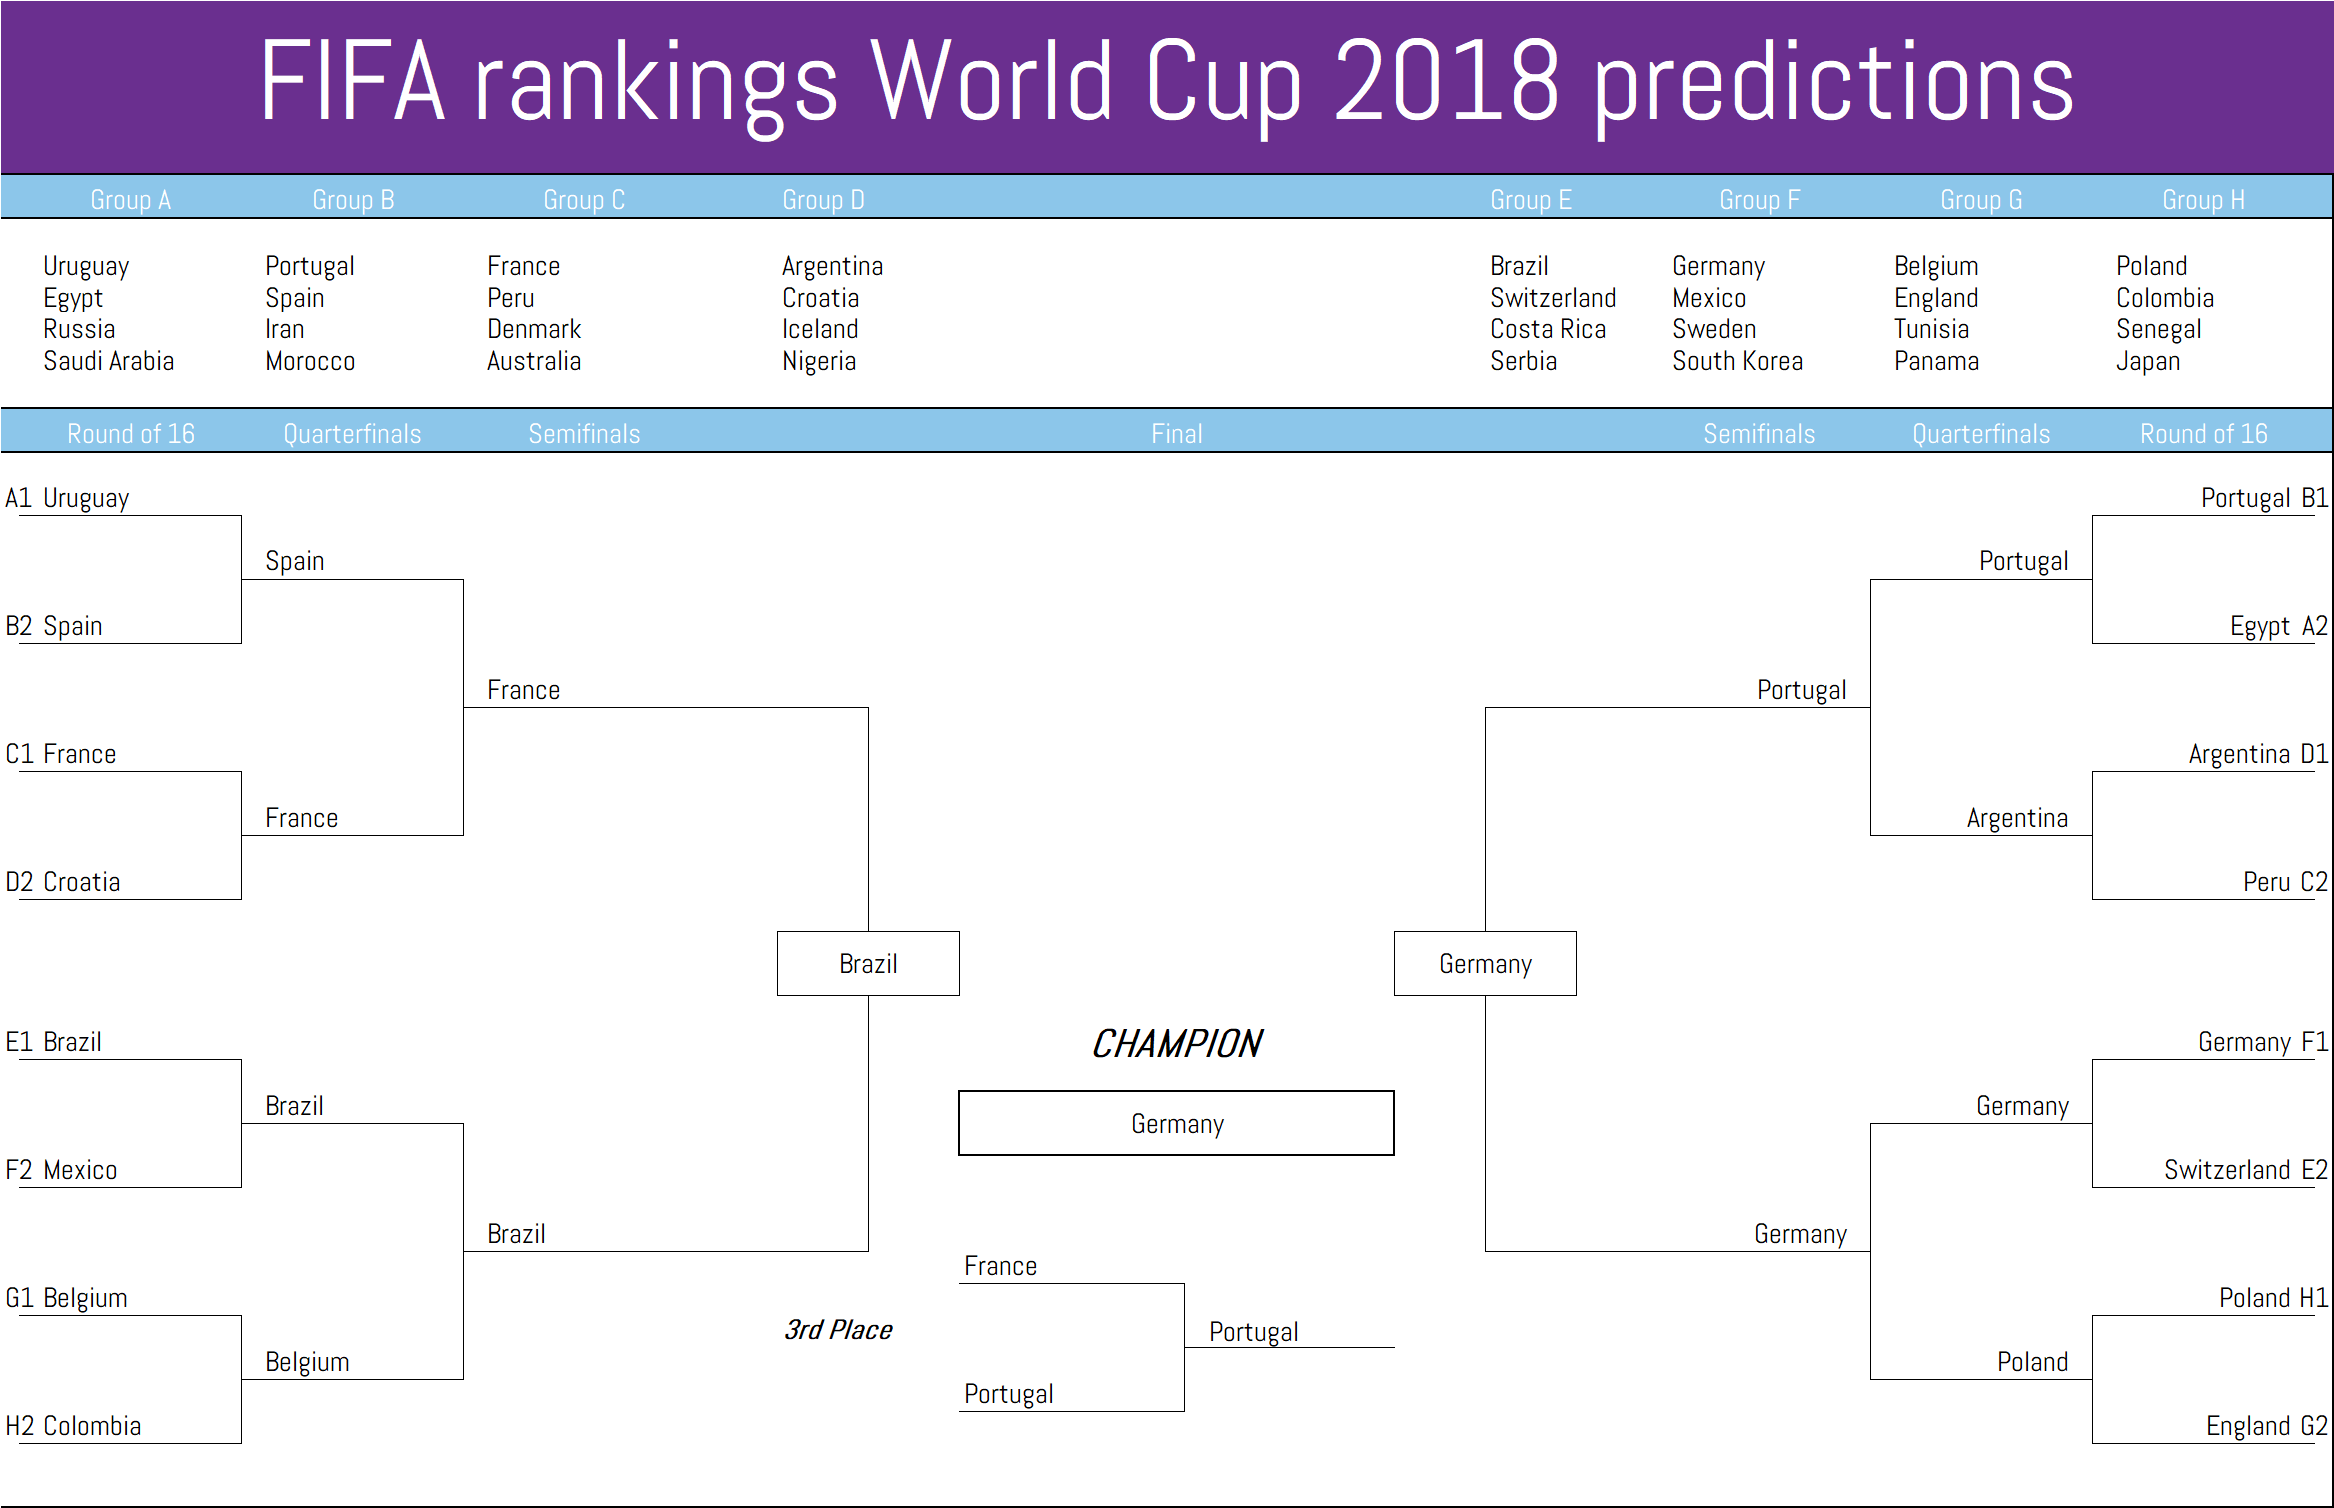
The bracket
Want to know where the model says to put your money? Here ya go.

Allez les Bleus!
We also appreciate how the historically weighted model has England losing at the quarterfinals to (who else) Germany. Because somethings even randomly drawn balls from pots cannot change.
Now, compare our bracket to the one you get if you trust the FIFA ratings:
The main differences:
- France (#7) and Argentina (#5) are underrated by FIFA. So if you’re looking for possible teams in the final four that might give better odds than just saying “Brazil” and not thinking at all, then there you go.
- Portugal is overrated, which makes sense given much of their recent FIFA boost was because of the field collapsing on their side of the bracket at Euro 2016 and then putting together one excellent game against France in the final.
- FIFA also overrates Belgium and Switzerland, but since the draw sees them likely knocked out by powerhouses Brazil and Germany (rated highly by both systems because duh), it doesn’t affect the later stages of the tourney.
Wondering about the methodology? Jump to that section!
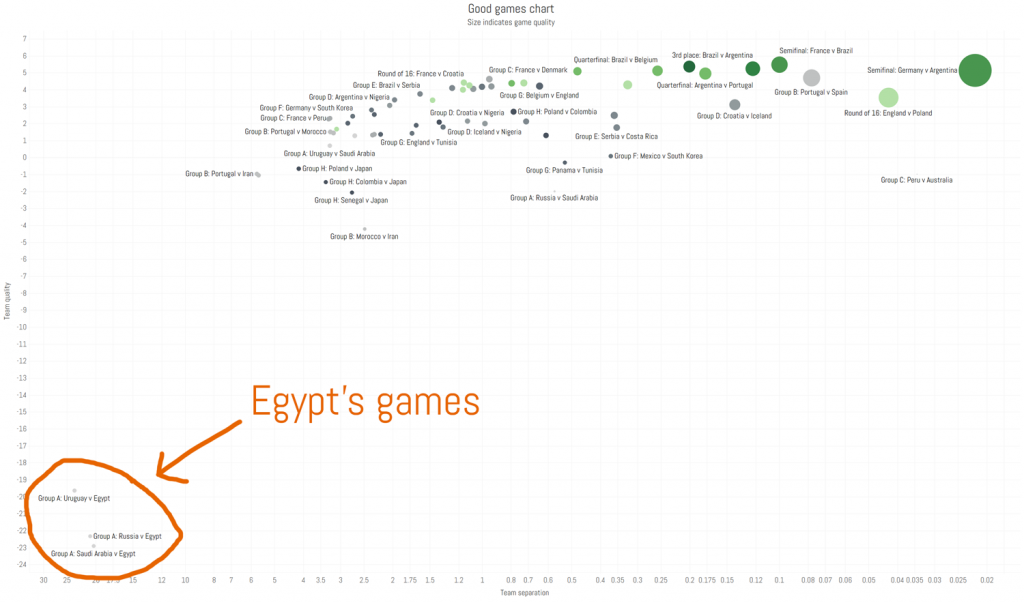
Games to watch
My prior: the best games tend to be those that have both the highest team quality and the lowest team separation (the difference in quality between the two teams). Blowouts like Brazil 1-7 Germany or Brazil 4-1 Italy are historic, breathtaking, shocking, and utterly amazing spectacles, but they’re not necessarily the best-played games (at least by both sides)
Mouseover for details.
- As in many tournaments, the best games happen to be in the semifinals. Specifically, keep an eye out for Germany v Argentina.
- The fact that Portugal v. Spain shows up as the best group game is no surprise. For the next best….would you have guessed Croatia v. Iceland? No, but it actually makes sense when you think about it. Both decent teams that will be playing for likely progress to the next round in their group behind Argentina.
- Games to avoid: Egypt has historically been so bad relative to its demographic expectation that I had to cut them out of the dashboard to get any kind of resolution from the entire rest of the pool. They’re not even the worst-rated team at the world cup (by Feng), but they have had the most futile historical performance by far. A measly 2 points in 4 games for a 0.167 points percentage and just two points. To put it another way, they are the only non debutante nation (Iceland, Panama) to not even have a single solitary win. Iran (v the USA in 1998) and Tunisia (v. Mexico in 1978) each have 1.
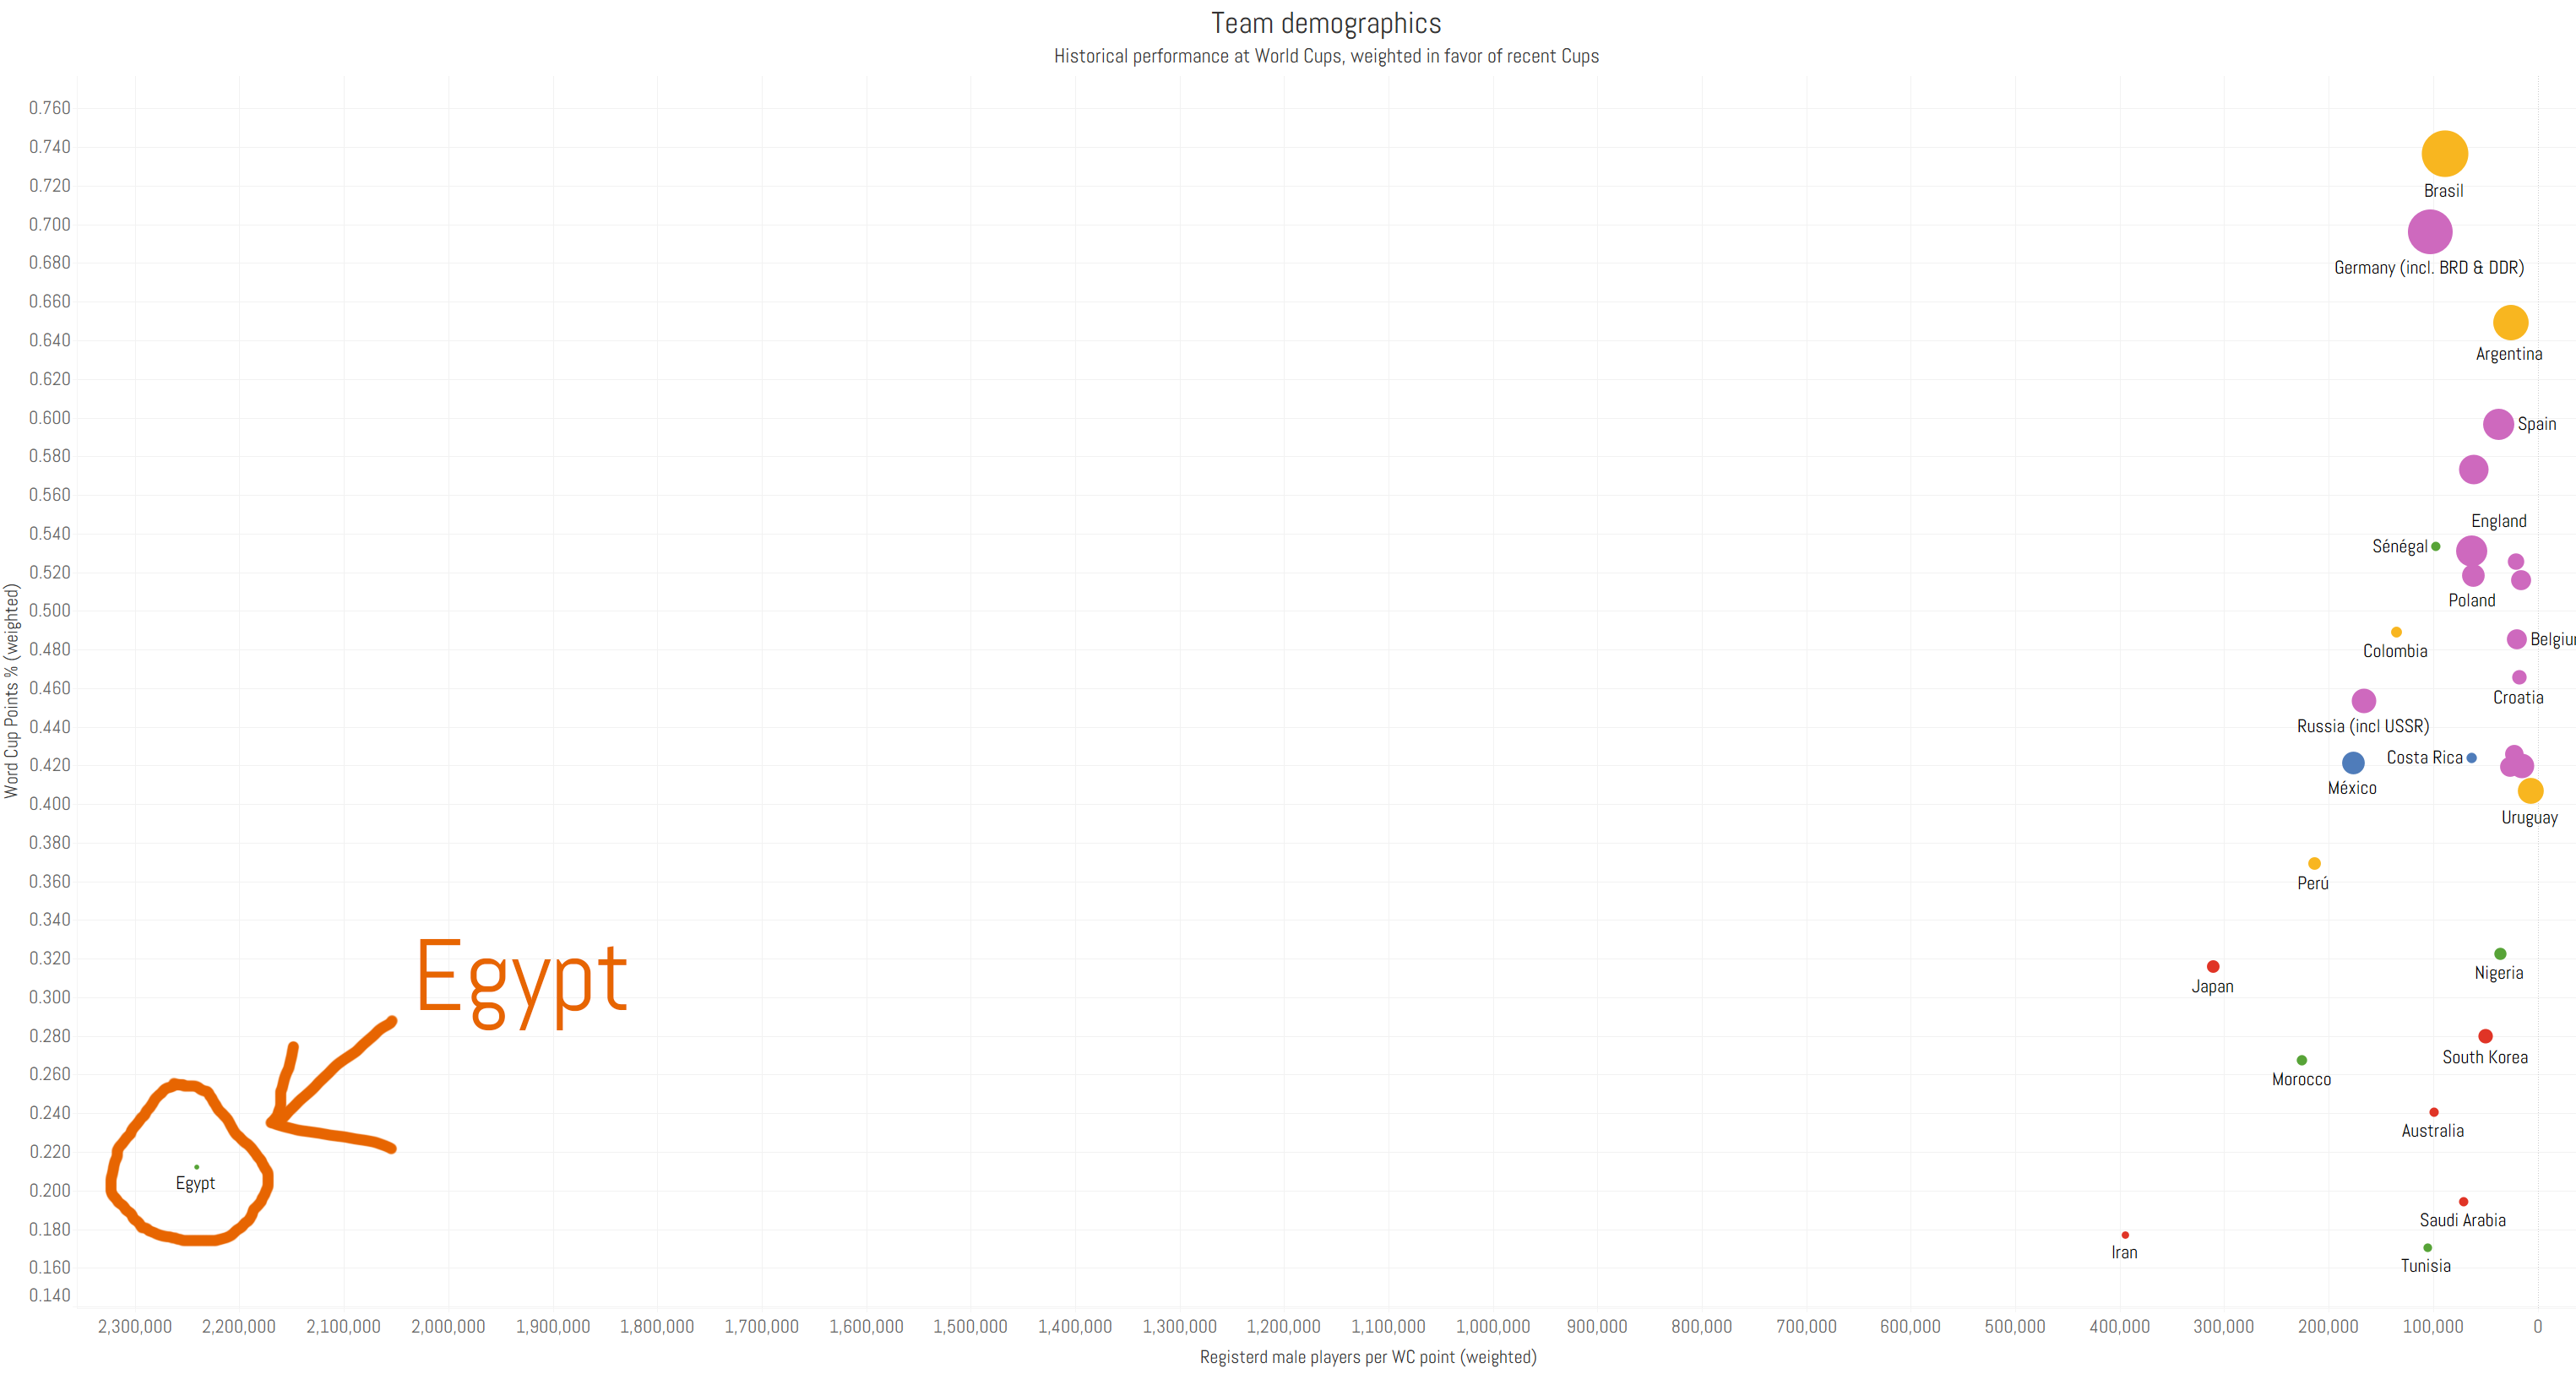
Don’t believe me? Here’s the team dashboard with Egypt’s three group games included:
And here’s the team strength chart with a standard x-axis:
- And now you know why Egypt’s games are rated so poorly. Because, if past World Cup performance compared to their very large player pool (3.1M, only 700K less than England’s and about the same as the entire population of Uruguay) is indicative of anything, they stink.

All games, with predictions and game quality scores
Want to know how our model sees each and every matchup? Of course you do.
Mouseover for details.
Teams, with ratings and predicted finish
¿Quién es más macho?
France, evidently, though the model sees the top 7 teams as all having a decent shot at the title.
Things drop off pretty quickly after Spain in #7, with almost as big of a ratings gap between them and #8 Uruguay (0.33) as there is between them and #2 Brazil (0.37).
Mouseover for details.
Also, be sure to scroll down if at first you don’t see Egypt.
The methodology
For current team strength, we’ll use Ed Feng’s The Power Rank because we like the methodology based on margin of victory, team strength, and game context (friendly, World Cup game, continental championship, etc) and have a thing for applied mathematicians who like sports. Feng’s rankings produce an expected margin of victory over an average international team (which happens to be #88, Iraq). As expected, every team that qualified for the 32 team World Cup is above the average quality of FIFA’s 210-member pool (though Saudi Arabia only barely).
I then went and looked at the only even semi-reliable measure of each country’s player pool, the FIFA Big Count of 2006 (yes, they haven’t done one in 12 years, which is frankly absurd). I then calculated each of the qualifying teams’ point totals from past world cups (using the current system of 3 points for a win and 1 for a draw), per capita, weighted so more recent World Cups are given more weight. So, a tie in 2014 was worth 1 point but one in 1930 only 0.05 (yes, Uruguay is still a collection of tiny badasses, even with their 1930 and 1950 World Cup wins not given full weight).
This gets us historical performance/cap, which I used to modify present rating, comparing each team relative to the average of all WC qualifiers.3
ratingteam = -(z-scorehist/cap)*4+(z-scoreFeng)
What’s next?
Honestly, no one will really care about all this methodological discussion unless the model turns out to work. Ergo, the next step is to see if there’s anything to this.
Model-building is a process. Evaluate, revise, keep iterating until you have something that you can throw in FIFA’s face every time they come out with those ridiculous rankings.
Stay tuned next month as we compare predictions to reality!
Notes:
1 Their first of 6 penalty losses to 1 win (a QF win over Italy at Euro 96). The Germans are 4-0.^
2 Yes, some of these are based in systems of player and coaching development. The Dutch do in fact encourage fluid positional interchanges, tiki-taka is still the most influential tactical schema in Spain, the Brazilians produce a lot of individual dribblers, and Italians have an unmistakably ruthless pragmatism.^
3 For teams with no World Cup history (Iceland, Panama), I treated their z-scores as 0 and just went with the current rating. Iceland might have a punchers chance of advancing out of its group (it did so famously at 2016), and Panama is probably toast.^
No Comments on "What countries punch above their demographic weight at the World Cup (and can this be predictive)?"