By: Richard W. Sharp
Something fascinating about March Madness is that the smart money always loses. You’ll always do respectably in the office pool, but you’ll never beat that guy who went to Davidson in 2008 and was Steph Curry’s roommate. Unless you pick some upsets, usually based on irrational faith in your alma mater, you’ll finish in the middle of the pack.1

In order to produce a more widely useful pseudoscientific method we’re going to add a tried and true wildcard factor to the analysis: mascots. Yes, there have been plenty of “let’s rank the mascots articles” in the past, but we’re not here to talk about the past, we’re here to settle the most important question of the day. We’ll start with a model based on the safe bets, then mix things up a bit (but not too much) by factoring in our own, highly-biased-toward-wildcats mascot ranking.
The question
So how much randomness is the right amount? What dosage of crazy maximizes your potential outcome?
The smart money
First things first, how do we generate a consensus among the experts? Who are the experts? That at least isn’t too difficult to answer. There are many team ranking systems out there. Top 25 polls, like the AP poll are well known, but not very useful for us. We’ll need a ranking that at least covers all of the teams in the tournament. The best known of these is probably RPI, but there are literally dozens of others.2 Fortunately, a large selection of these polls have been recorded for posterity by the folks at Massey Ratings. From RPI to BPI to 7OT they’ve got you covered.
Next we’ll need to see how these rankings fared in the past. For that we turn to the folks at Kaggle, who hosted a contest on this very subject last year, complete with handy historical data. We’ll score each ranking system by first turning the ranking into a bracket (for each pair of teams, the top ranked one moves on to the next round). For each correct pick, points are awarded. There are lots of schemes out there, but we’ll keep it simple: play-in games are excluded, and the points-per-correct-pick in each round are as follows: 1, 2, 4, 8, 16, 32 (for a consistent total of 32 possible points each round).
Each of the polls was scored for the 2010-2015 seasons and the results compiled in the chart below. There’s quite a bit of variation from year to year, but it’s clear that some polls are better than others. RPI does not impress (keep scrolling, scrolling, scrolling… there it is!).
| Ranking the models: How much better are they than RPI? | |||||||||
|---|---|---|---|---|---|---|---|---|---|
| Ranker | 2010 | 2011 | 2012 | 2013 | 2014 | 2015 | mean pts (of 192) | mean %possible pts | mean % above RPI |
| Sagarin | 85 | 46 | 135 | 116 | 64 | 96 | 90.3 | 47.0% | 34.2% |
| Doktor Entropy | 88 | 49 | 127 | 114 | 59 | 99 | 89.3 | 46.5% | 32.7% |
| Bobcat | 85 | 46 | 129 | 117 | 65 | 90 | 88.7 | 46.2% | 31.7% |
| Whitlock | 84 | 51 | 130 | 117 | 60 | 84 | 87.7 | 45.7% | 30.2% |
| Kirkpatrick | 89 | 50 | 119 | 115 | 60 | 90 | 87.2 | 45.4% | 29.5% |
| Pigskin | 85 | 46 | 125 | 114 | 68 | 84 | 87.0 | 45.3% | 29.2% |
| Sport Theory | 85 | 47 | 118 | 116 | 61 | 90 | 86.2 | 44.9% | 28.0% |
| Pomeroy | 110 | 50 | 132 | 83 | 60 | 78 | 85.5 | 44.5% | 27.0% |
| Sagarin-Elo | 65 | 47 | 122 | 116 | 68 | 90 | 84.7 | 44.1% | 25.7% |
| Rothman | 67 | 47 | 121 | 113 | 61 | 94 | 83.8 | 43.7% | 24.5% |
| Wilson | 67 | 46 | 132 | 111 | 68 | 78 | 83.7 | 43.6% | 24.3% |
| Wrathell CPA | 79 | 46 | 130 | 87 | 56 | 103 | 83.5 | 43.5% | 24.0% |
| Massey | 66 | 51 | 122 | 109 | 67 | 83 | 83.0 | 43.2% | 23.3% |
| Pugh | 67 | 45 | 120 | 108 | 68 | 87 | 82.5 | 43.0% | 22.5% |
| Dance Card | 72 | 59 | 130 | 80 | 65 | 87 | 82.2 | 42.8% | 22.0% |
| Cheong | 79 | 47 | 125 | 86 | 57 | 99 | 82.2 | 42.8% | 22.0% |
| Moore | 88 | 51 | 78 | 115 | 64 | 88 | 80.7 | 42.0% | 19.8% |
| Daniel Curry Index | 86 | 48 | 79 | 115 | 61 | 86 | 79.2 | 41.2% | 17.6% |
| LRMC | 86 | 45 | 131 | 69 | 61 | 73 | 77.5 | 40.4% | 15.1% |
| Krach | 66 | 45 | 126 | 64 | 69 | 89 | 76.5 | 39.8% | 13.6% |
| Wobus | 66 | 46 | 126 | 60 | 68 | 91 | 76.2 | 39.7% | 13.1% |
| Dolphin | 65 | 49 | 118 | 64 | 69 | 91 | 76.0 | 39.6% | 12.9% |
| Wrathell CPA Retrodiction | 52 | 41 | 140 | 67 | 62 | 92 | 75.7 | 39.4% | 12.4% |
| Bihl | 66 | 49 | 118 | 60 | 68 | 91 | 75.3 | 39.2% | 11.9% |
| RoundTable | 86 | 43 | 67 | 100 | 50 | 105 | 75.2 | 39.1% | 11.6% |
| Rewards | 61 | 48 | 113 | 55 | 66 | 106 | 74.8 | 39.0% | 11.1% |
| Wolfe | 66 | 45 | 117 | 59 | 62 | 91 | 73.3 | 38.2% | 8.9% |
| Nolan | 68 | 51 | 109 | 55 | 56 | 76 | 69.2 | 36.0% | 2.7% |
| Colley | 66 | 51 | 85 | 52 | 68 | 84 | 67.7 | 35.2% | 0.5% |
| Snapper’s World | 80 | 49 | 80 | 52 | 62 | 82 | 67.5 | 35.2% | 0.2% |
| Real-Time RPI | 69 | 48 | 82 | 56 | 61 | 88 | 67.3 | 35.1% | 0.0% |
| RPI | 69 | 48 | 82 | 56 | 61 | 88 | 67.3 | 35.1% | 0.0% |
The stupid money: Mascots
To introduce a little chaos to the order of the various polls, we’ve ranked the mascots of the top 100 teams using a patented infallible method: our gut. Hey, we’re trying to pick something random that has no bearing on team performance!
In a two-step process, mascots were ranked by category, then the categories were modified as we pleased. There were some simple rules: originality is to be rewarded, and mascots should be nouns (that’s bad news for Syracuse). So at the top we find forces of nature (hurricanes) and we progress all the way down to colors (again, mascots should be nouns).
Some mascots are deserving of extra praise or scorn, which is added or subtracted from their base category. Bonuses were awarded for fierceness (e.g., Wolverines, Yellow Jackets). Yosemite Sam style characters (aggressive caricatures of men such as Mountaineers or Trojans) were generally penalized for unoriginality. Gandhi-like pacifists (Friars, or if the Quakers ever make it back) got a bonus for guts, and extra points for any team that knows you either go big or go home (Buffaloes, Bison!).
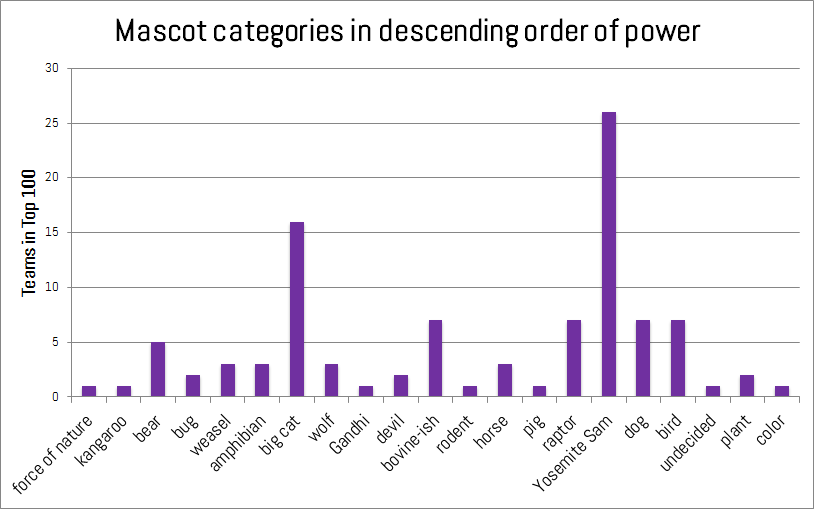
Mascot types, from highest to lowest weight.
Putting it all together
Finally, we need an ugly method or two for combing the good and the bad. Two methods showed some promise for adding the randomness we need to win a pool to the mix.
The first is a way to combine multiple polls through a voting procedure: for each team, a specified number of polls are chosen at random (with replacement) and the team is assigned the average rank among them. This is similar to just taking the average between all of the polls, but it gives us some idea of the range of potential outcomes that are possible, instead of just the center of the range. Early exploration also revealed a case in which two heads are better than one: combining the Kirkpatrick and Pigskin polls can outperform the Sagarin poll (the highest-average performer).

However, we’ll use a second, simpler approach to add in the mascots. We’ll grade on a curve by adding zero-mean normally distributed noise to the top individual polls. The mascot ranking can be scaled to this bell curve once we decide how wide to make it (standard deviation is now related to the number of steps in the ranking we’re willing to let a team rise or fall at random).
But how much randomness should we pour on the fire? Let’s find out.
We know that no noise at all won’t do us any good, but also, too much noise would just produce a random bracket which wouldn’t be very useful either. Our goal is to win the pool as often as possible, not just get the highest average number of points, as many pools award no cash for second place. We’re trying to maximize money, not correct picks.
So, we need to use enough noise to maximize our chance of a significant improvement over the model. We want to look for the best best-case scenarios and accept that these will blow up in our faces more often than the models but also more often turn up winning brackets (nothing ventured, nothing gained). The chart below shows the 90th percentile of points gained through adding randomness at different noise levels (standard deviation).
All three schemes below show a clear peak somewhere around 4 to 6 on our noise scale. Bingo!
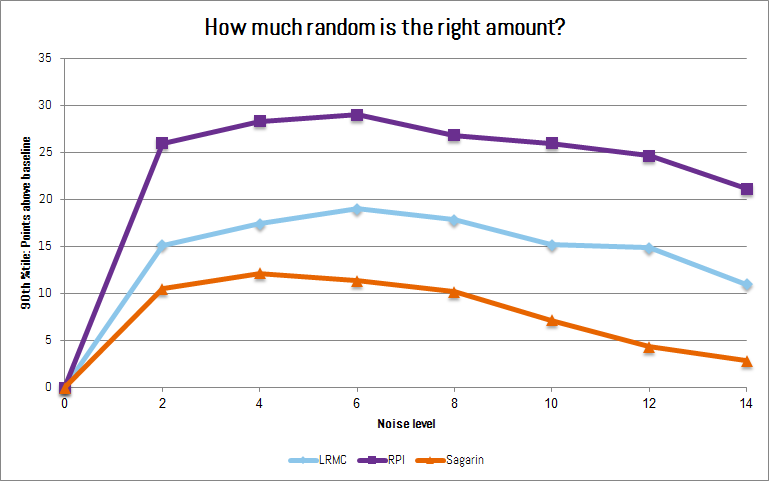
The sweet spot to maximize your bracket wins: That hump between 4-6.
Coming soon
Over the next couple days we will produce a large number of brackets combining some of the top polls with mascot seeded randomness (games start Thursday, 3/16). We’ll track these through the tournament and report back in a couple weeks.
1 As a Northwestern alum, I think it’s finally my year in more ways than one. Look out, fellow bracketeers. ^
2 One personal favorite is the LRMC model. It’s Bayesian at heart and based primarily on point difference outcomes from all regular season: simple in concept, complex in spreadsheet.^
No Comments on "March Madness Bracketeering"