By: Richard Van Heertum
In the biggest political upset since Truman beat Dewey in 1948, Donald J. Trump will be the next President of the United States. Like many Americans (one could argue the majority, based on the popular vote), that thought gives me great pause. A campaign that centered on racism, sexism, fear and xenophobia has rewritten the electoral map of the country and, potentially, our collective future. Trump ran a campaign that defied the odds, failing to incorporate the sort of ground game generally necessary for victory, receiving more negative press than any candidate in recent memory, losing all three debates and trailing by a deficit no candidate has ever overcome, at least since modern polling began. And yet he won and will soon sit at the helm of the epicenter of global power.
This three-part series explores the demographic, political framing and outside influences that led Trump on the road to his unlikely victory. Part 1 below looks at the election in a general sense and then focuses on five key demographic influences on the outcome. Parts 2 and 3 then turn to political messaging/framing and outside influences that influenced the campaign.
The Question
In this series, rather than contemplating what the future holds, I will try to explore the reasons for Trump’s narrow victory, starting with the key demographics.
The Short-Short Version
There are many reasons for Trump’s victory to consider, and the exit poll of almost 25,000 American voters, though an imperfect metric, provides the most compelling available insight into the election. In concert with voting pattern data, Pew Research Institute findings and other relevant sources, the combined empirical evidence gives us great insight into how Hillary Clinton lost an election she seemed certain to win. As former prognosticator extraordinaire Nate Silver pointed out on the eve of this historic election, the possibility of a Trump victory was always greater than many in the media, and almost all the pollsters, believed. And yet, given the general tenor of the campaign and antipathy toward Trump, few saw this result coming.
Three factors do stand out as essential in providing context to the election:
- First, the fact that Hillary Clinton was the most unpopular Democratic candidate to ever run for our highest office, with an average -12.6 favorability rating on the eve of the election, according to Real Clear Politics. That is, of course, until we turn to her Republican opponent, Trump, who stood at -20 percent in the same aggregator.
- Second, the FBI and their unprecedented action on October 28, reopening the investigation into Clinton based on the spurious reasoning that they found new emails that could indicate criminal activity.
- Finally, the boiling anger in the country looking for an outlet to express itself.
Before we do turn to the numbers, one final point is worth noting. Even as Donald J. Trump will be sworn in as the 45th President of the United States early next year, he is currently losing the popular vote by over 1.1 million votes. Democrats also received more votes for their Senatorial and House of Representative candidates. The nature of the electoral system and electoral college in America, the outsized influence of campaign financing since the Citizens United decision of 2010, along with effective gerrymandering by Republicans over the past 25 years, means that, even with these deficits, they now control the levers of power across two of the three branches of the government (set up nicely to seize control of the third), the majority of governors, state assemblies and local officials.
1 – Whites voted for Trump at historic levels
Trump, unsurprisingly, won this election by getting out the white vote. What few thought possible was the historic level at which he won that key demographic. Trump outpaced even Ronald Reagan in amassing a 21-point victory among whites, 58% to 37%, over Clinton. To be fair, that is only one percent higher than both Reagan in 1984 and Romney four years ago, but it was enough to push him over the hump. Clinton won among non-whites by an even larger margin, 74% to 21%, but that was not enough to make up for white voters turning enough blue states red.
As many have noted, Trump won the white working class vote (which makes up greater than 40% of the electorate) by a sizable margin, shifting reliably Democratic states like Pennsylvania and Wisconsin (which hadn’t voted for a Republican since 1984) into his column. But it is also important to note that he also marginally won the white college-educated vote (49% to 45%). Whites without college degrees favored Trump by 39 points (67% to 28%), 14 points better than Romney could muster a mere four years earlier (61% to 36%). This surprising result among college-educated whites may be one major reason the pollsters got it wrong.
Apparently, racism, sexism and xenophobia play in the heartland. In fact, the American National Election Study 2016 run early this year found that support for Trump increased as racial animus and racial resentment rose, with many Trump supporters finding truth in the stereotypes that blacks, Muslims, and Latinos are “lazy” and “violent.” Rather than looking specifically at racism, these studies used a series of questions to test whether respondents tended to believe stereotypes about groups that influenced their general impression of those groups and their economic, political and cultural prospects.
One could argue that these feelings are not terribly surprising given the economic depression that so many white working class families have felt for the better part of four decades now1 and the reality that Democrats, since at least Bill Clinton, have done too little to assist them. Democrats have lost the white working class not only in Kansas2 but now across the Rust Belt and in Southern states like Florida and North Carolina, where demographic shifts seemed to favor them.
One interesting argument to consider in this regard is that the resegregation of America and its schools has played a large role in this shift, as many white Americans outside of cities simply do not interact with those of other races, making it easier to suppress their empathetic impulses and for them to simply buy in to negative stereotypes. However, one could dig deeper and point to the Southern Strategy employed by Republicans ever since LBJ pushed through the 1964 Civil Rights Act. The racial animus of many Southerners, as African-Americans’ lives improved, has now spread out beyond the South.
Putting all of this together in one of the most astounding results of the election, Wisconsin saw a major shift among white voters, moving from a 54-45 margin for Obama in 2008 and a 48-51 margin for Romney in 2012 to a 53-42 deficit for Clinton last Tuesday.3 Similar trends emerged in Florida, Pennsylvania, Ohio and Michigan, turning the electoral map on its head. In total, the Washington Post reports that almost 700 counties that twice voted for Obama flipped to Trump in 2016, with many the decisive factor in close state voting patterns (see the Post’s map below).
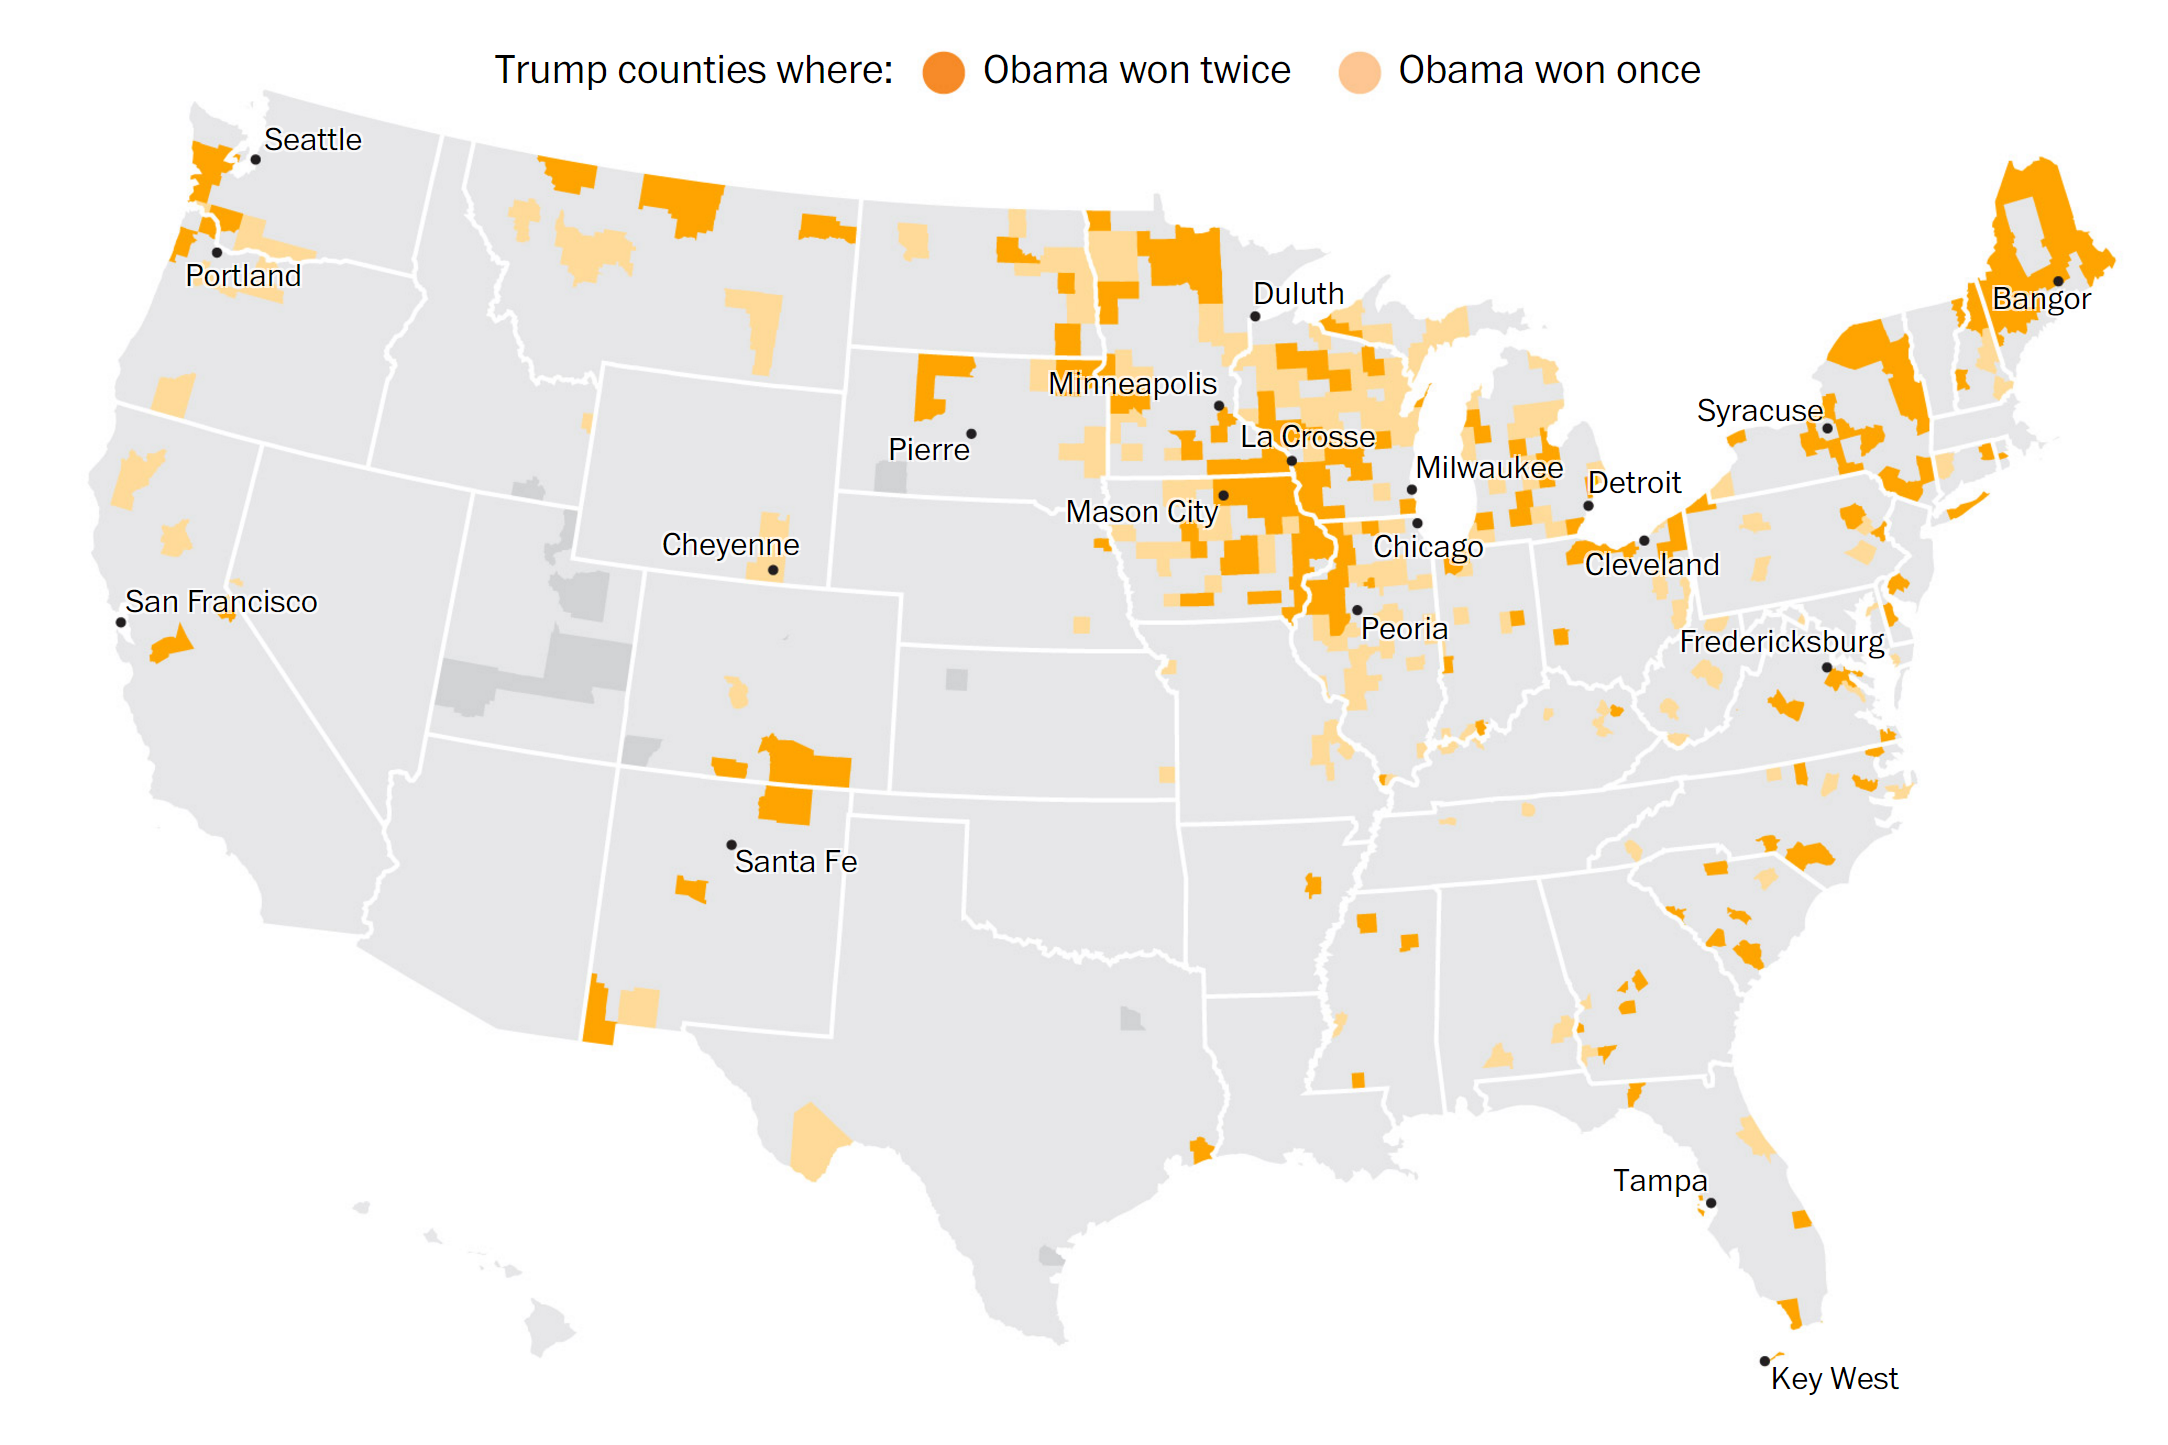 Counties that voted for both Obama and Trump. Image credit: the Washington Post.
2 – Women, particularly white women, did not support Clinton to the magnitude expected
There was little doubt that Trump was going to win among white men; his populist message, along with the aforementioned racist, sexist and xenophobic overtures, captured large swaths of that demographic. What was surprising was the fact it appeared to sway white women nearly as much. Before the election results started rolling in, the general consensus was that Clinton would crush Trump among women, particularly after the Entertainment Tonight tape emerged showing him bragging about sexual assault and attempted adultery with a married women. Instead it appears quite the opposite occurred, particularly for white women outside of cities.
Overall, the female percentage of the electorate actually fell, from 53% in 2012 to 52% last week, although, due to population growth there was a 1% increase in the total number of women voting. However, Clinton only outperformed Obama by one percentage point, winning by 12 points to the 11-point victory Obama claimed over Romney four years ago. One group that did strongly support Clinton was young women, as she won 18 to 29 years olds 63% to 31% – though that margin fell to four points (46-42) among men of that age group.4 Overall, she won 52% to 44% among those 18-44 while Trump won those 45 and older 53% to 44%. Since the older tend to vote at higher rates, that meant Clinton had to again energize young voters, as Obama did in 2008 and Sanders in the primaries. To put it simply, she did not.
The inability to bring home the female vote was particularly acute in Florida, where she only won among women by 4 points, compared to 16 points in Colorado, 13 in New Hampshire and Pennsylvania, 11 in Michigan and Georgia, 10 in Wisconsin and 8 in North Carolina. Even with those margins, she still lost Wisconsin, North Carolina, Pennsylvania and (probably) Michigan. The numbers do not lie in this case, if she had gotten out the female voters in those states, she would have been on her way to an electoral college landslide. The inability to get women or the young to take to the polls with sufficient numbers meant that Trump’s aging, white male constituency could ride him to victory.
One final point worth noting here is the 24-point gender gap in this election, almost as astounding as the racial gap between white and non-white voters and between the young and old. When the media says we are a divided country, they are not exaggerating!
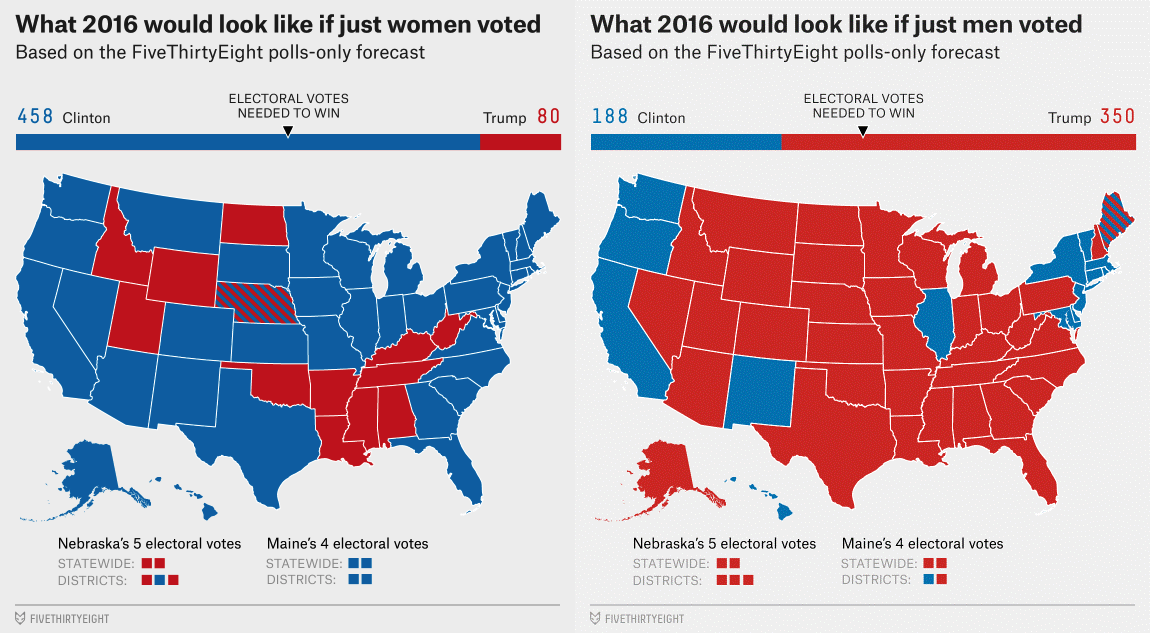 The FiveThirtyEight’s segmentation of the 2016 election by sex.
3 – Latino and black voters failed to respond to the threat
Clinton won the Latino and Black vote, as expected, but not at the level or magnitude expected. The percentage of white voters did continue to decline as a percentage of the overall voter pool, falling to 70% in 2016, after making up 72% of the electorate in 2012 and 86% in 1984. That declining share should have been enough to push Clinton over the top, but the margin by which she lost the white vote, together with slightly lower than expected levels of support among Latinos and Blacks, made the difference in this election.
A decline in black participation wasn’t that surprising, but Latinos not show up at the polls as expected was, particularly given the incendiary comments of Trump throughout his campaign. In 2012, Hispanics made up 10% of the overall electorate; in 2016 only 11%. More troubling for Clinton, Trump actually outperformed Romney among Latinos, winning 29% versus 27%, while she underperformed Obama, winning only 65% of those voters compared to 71% for the 44th President.5 Among blacks, she did win 88% of the vote and among Asians 65% (to 8% and 29% for Trump, respectively), but, as with women and the young, the turnout was not enough to counteract white and male turnout.
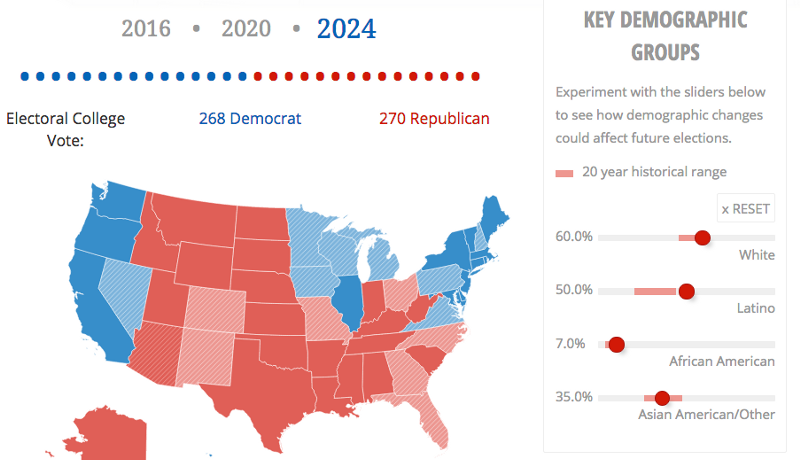 Interactive demographic sliders and map from FWD.us.
4 – Education levels mattered
Clinton did win among those with a college degree, by a 52 to 43 margin, but lost voters without by 8 points. This was a major difference from Obama, who was able to win both groups with approximately 50% of their votes. What caused the shift?
As with many other results from this election cycle, it appeared that Trump’s message resonated more with those who were less likely to critically reflect on some of his statements. Another less judgmental way to look at it is that Trump voters were more likely to be at the lower end of the economic ladder and more likely to be adversely affected by globalization, free trade and illegal immigration, all centerpieces of his economic messaging.
Interestingly, this was also true of white women without college degrees, who chose Trump by 62% to 34%, while white women with a college degree chose Clinton by 6 points (51% to 45%). White males without a college degree chose Trump by an astounding 49 points (72% to 23%), while college-educated males were half as eager, but still went with Trump, 54% to 39%.
However, some findings in the exit poll seem to conflict with this general narrative. Looking at income level, Clinton won those making under $50,000 (36 percent of the electorate) by a 12-point margin (52% to 41%) while losing those making $50K or more by a 49% to 47% margin (64% of the electorate). White working class voters mattered, particularly in the Rust Belt, but it appears more voters than expected chose their potential economic gains over any concerns about Trump’s fitness to be President. This perspective is backed by the fact that this was a more educated electorate than 2012, with about 50 percent of voters having earned at least a college degree.
5 – Turnout among rural and exurb voters Trumped the city folk
Of particular relevance to the turnout rates in swing states was the higher than expected turnout of rural and exurb voters compared with lower than expected turnout in many urban centers. In some states, the rural counties made the difference, while in others, drop in turnout in urban centers was decisive.
When one looks at the county maps for Florida, for example, they find almost the exact same voting patterns between Obama in 2012 and Clinton in 2016 (with only Jefferson, St. Lucie and Monroe counties flipping). And yet Clinton lost Florida by about 120,000 votes, while Obama won it by over 400.000. How is that possible? The obvious answer is that turnout was stronger in the red areas of the map than the blue city centers of Miami, Orlando and Tampa.
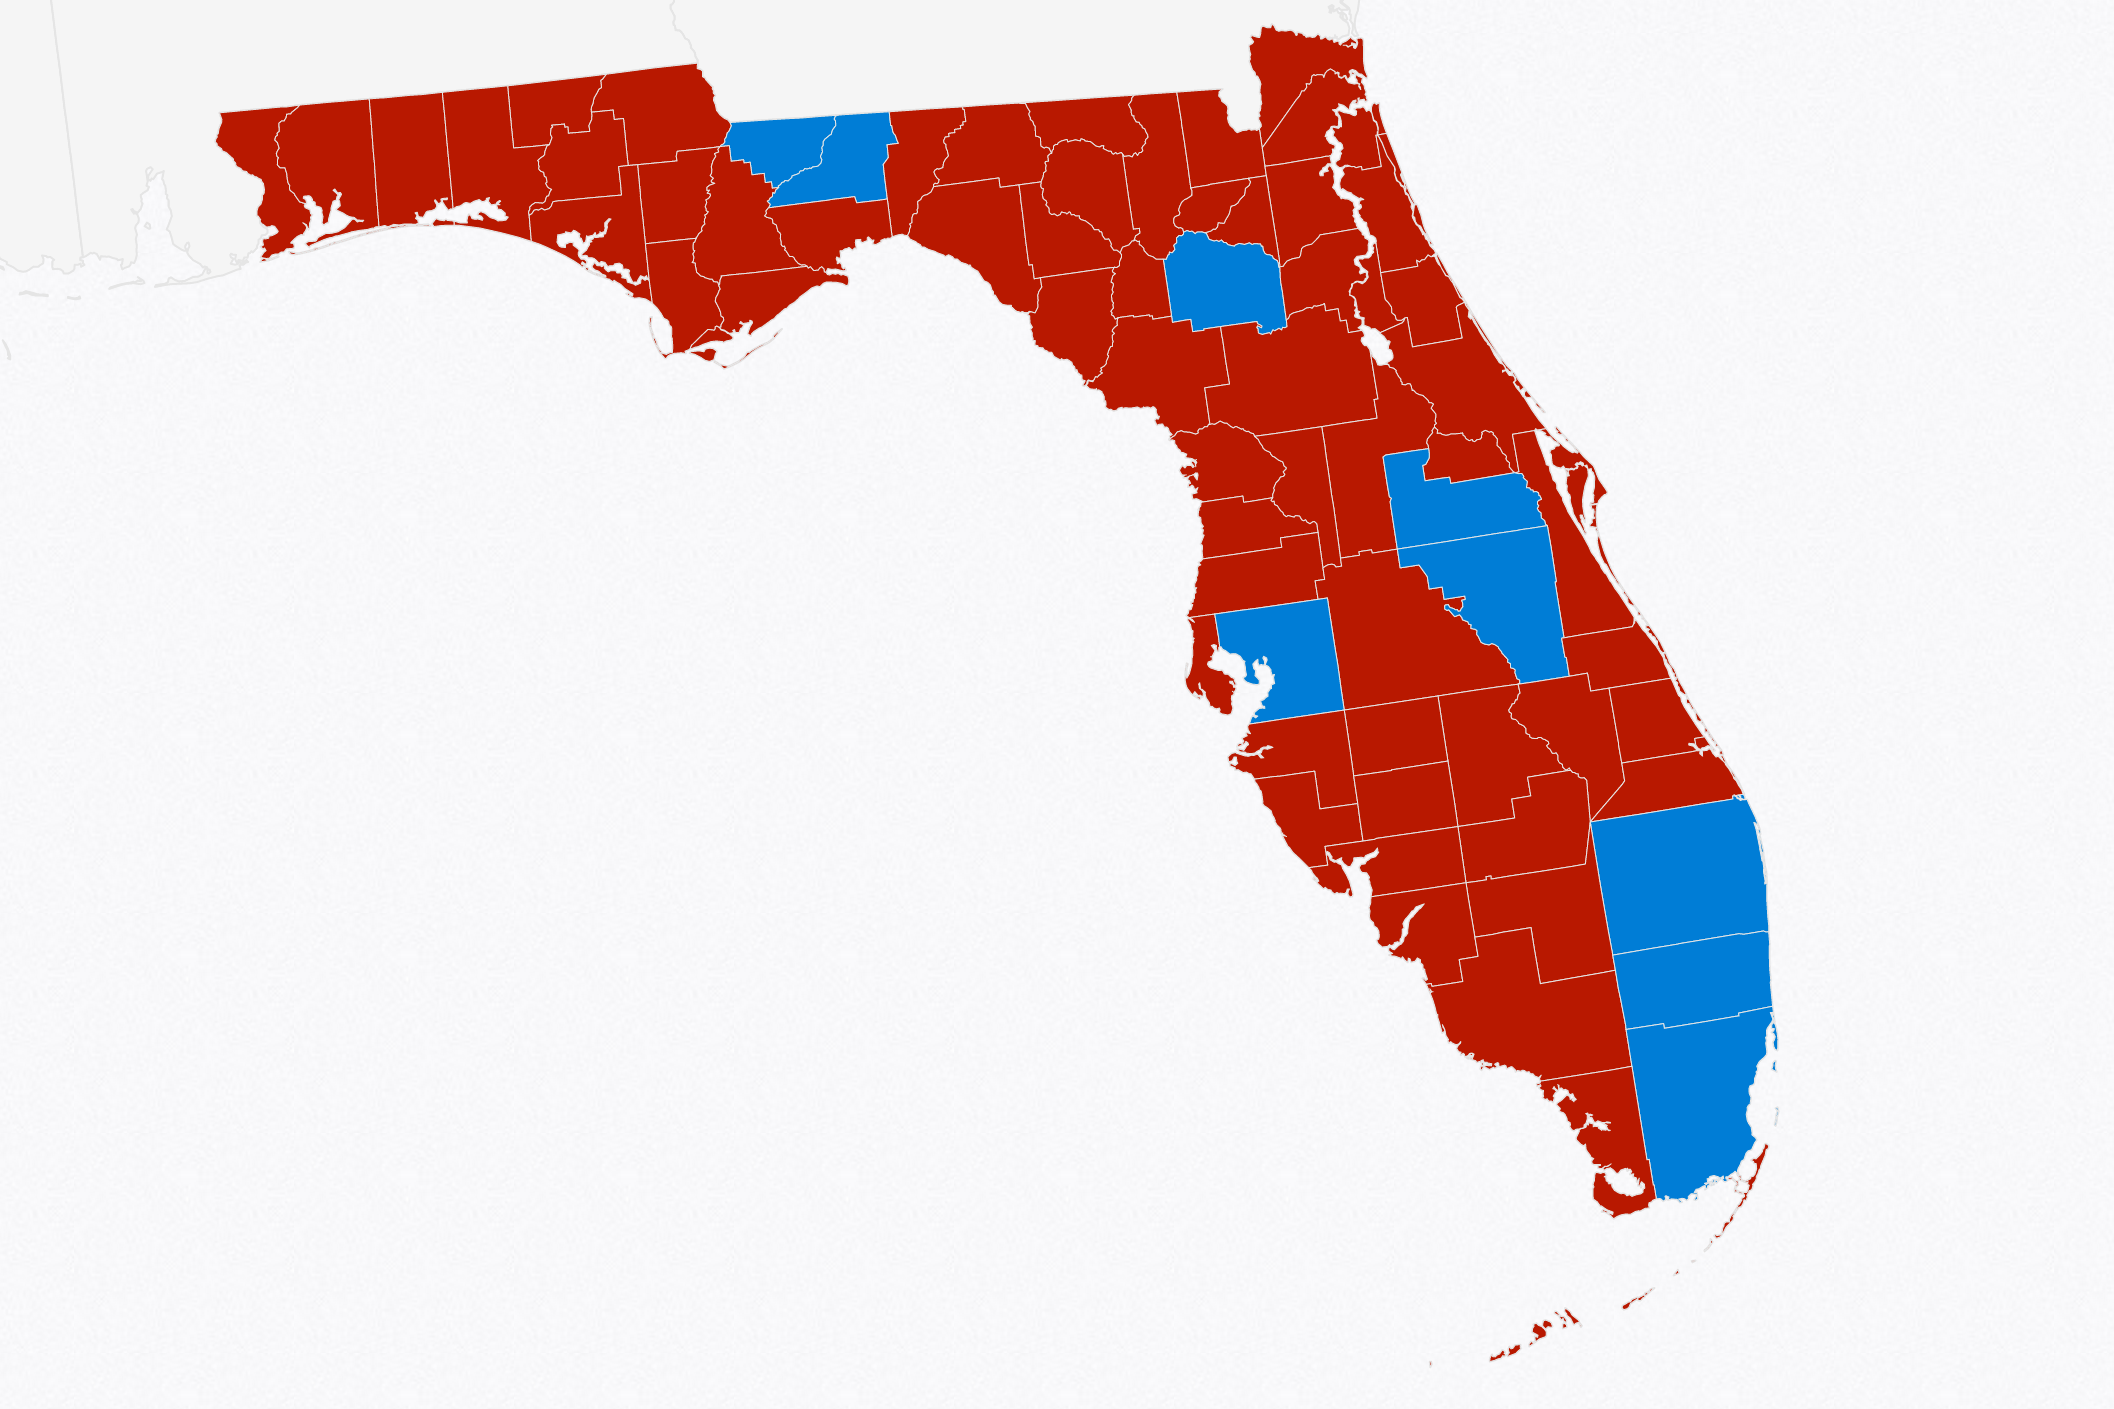 2016 Election, county-by-county breakdown map from Politico.
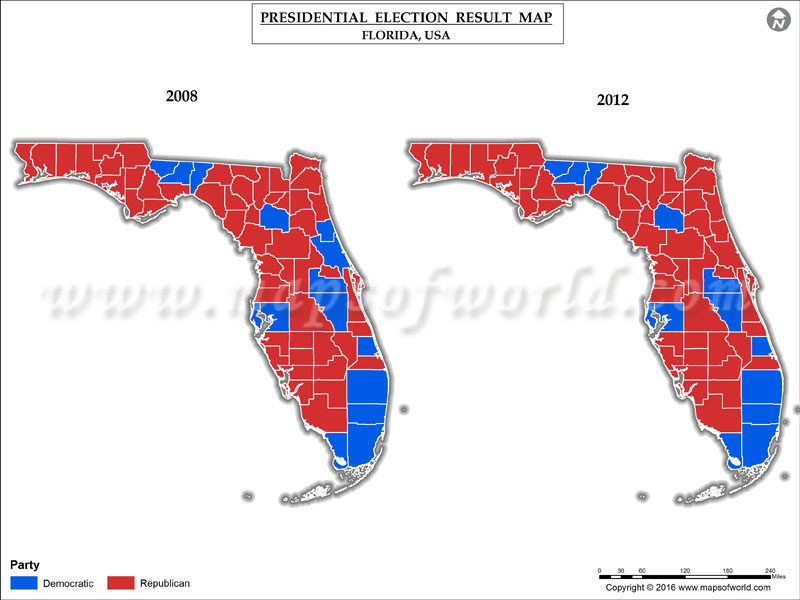
2008 and 2012 Elections, county-by-county breakdown map from Maps of World.
These trends held up in other swing states, though Trump was actually able to make more of those counties red in Wisconsin,6 North Carolina,7 Ohio8 and, most dramatically, Pennsylvania.9 In fact, his turnout in rural areas was so strong he almost turned Minnesota, a state that hasn’t voted for a Republican candidate for President since 1972, red.
In Pennsylvania, one can see the shifts in voting patterns in particular counties, which turned the state from blue to red for the first time since 1988. Four northeast counties – Northumberland, Schuylkill, Lackawanna and Luzerne – combined to give Obama 18,561 more votes than Romney in 2012. In 2016, they provided 63,917 more votes for Trump, with the shift greater than the deficit of 68,917 votes by which Clinton lost the state. In Michigan, it was just one county that made the difference – Wayne. In 2016, Trump picked up a few votes in the county in comparison to Romney in 2012, but Clinton fell almost 80,000 votes short of Obama, in a state she is currently losing by around 12,000 votes. And in Wisconsin, which hasn’t gone blue since 1984, three counties played an outsized role in Clinton’s loss. Milwaukee, Racine and Kenosha saw a drop in overall turnout in 2016, but Clinton’s declines were much worse. The decline in the margin in those counties for Clinton, of 32,539 votes, is more than the 27,257 vote margin for the state.10
In 159 counties in total, mostly in the Midwest and Appalachia, Trump ran 12 points better than Romney,11 and those small gains outside the city centers were arguably the margin of victory for Trump in the electoral college.
Summing up
In a broader sense, the notion of “red” states and “blue” states seemed somewhat flawed, as are most virtual borders like these. There are red and blue pockets in almost every state and this is even truer in the swing states each cycle. Democrats have generally been able to get out the vote more effectively than Republicans, at least in five of the past six cycles, but Clinton’s team seemed to be behind Obama in strategic targeting of voters.
It seems less that Trump outmaneuvered Clinton on the ground than that Democrats seemed unable to predict the power that voters outside urban centers would have on the overall outcome, while failing to galvanize enough of their own base to actually get to the polls and vote.
What’s next?
Part 2 of this series moves from demographics to strategy and messaging, looking at why the Trump demographic felt so attracted to his ideology and/or repelled by the Clinton campaign.
Part 3 will finish off our Election Postscript with a look at factors outside the election itself. What else affected the outcome (spoiler alert: James Comey is involved)?
1 See J.D. Vance’s Hillbilly Elegy for a relatively compelling, though arguably skewed, perspective on their general ideology.^
2 See Thomas Frank’s What’s the Matter with Kansas.^
3 Joy Ried, “Why Pres. Obama voters went for Trump,” MSNBC, 12 November 2016.^
4 Clare Malone, “Clinton Couldn’t Win Over White Women,” The FiveThirtyEight, 9 November 2016.^
5 Chris Cillizza, “The 13 most amazing findings in the 2016 exit poll,” The Washington Post, 10 November 2016.^
6 Per MSNBC.^
7 Per NY Times.^
8 Per Politico.^
9 Per CNN.^
10 Allan Smith, “How Donald Trump blew up the electoral map,” Business Insider, 13 November 2016.^
11 Perry Bacon, Jr., “How the 2016 Election Exposed America’s Racial and Cultural Divides,” NBC News.com, 11 November 2016.^
@rvanheertum, have you seen any evidence to show, one way or another, what effect the changes in the Voting Rights Act had on the Latino and Black Vote? I have heard few examples of Election Day voter intimidation at the polls, which was a big fear going in, but there are some arguments being made that the low minority turnout was due as much to renewed systems of voter suppression as to Hillary’s strategy or appeal.
Oddly, beyond a story here or there (purely anecdotal) about a few voters here or there, this didn’t appear to be a big issue. It will be interesting to hear more in the coming months but I get the sense that the GOP’s efforts to suppress the vote were substantially more effective before the Voting Rights Act was scuppered. For example, it was a relatively big deal in Florida in 2000, where Gore would have won easily but for the effective efforts to disenfranchise as many as 30,000 black men who might have otherwise voted, by blocking polling sites, fake phone calls that they could vote the weekend after the election and other devious plots by Bush’s governor brother (and failed presidential candidate this year) Jeb.
This is one aspect of the election that there seems to be no real consensus on. I’ve heard theories, on the one hand, proclaiming that voter suppression explains the entire thing, and on the other, that it didn’t matter at all.
I’d love to see something more in-depth done, as a general rule, not on voters or likely voters, but a longitudinal study on people who didn’t vote, and why. It would take some time and some legwork, of course. Do you know of anyone working on something like that already?
@pzed – I did find this article: http://heavy.com/news/2016/11/election-results-2016-voter-id-suppression-wisconsin-trump-clinton-hillary-north-carolina-ohio-arizona-polling-places-closed-reduced-decreased-closures-registration-purged/. It claims there were reports of voter suppression in every state, but that it is unlikely it affected the outcome. It is worthy noting, though, that Wisconsin had its lowest turnout in 20 years and that voters had “at least 868 fewer places to cast ballots in the 2016 presidential election than they did in past elections, a 16 percent reduction.” Again, it seems too early to know, but it didn’t help Clinton to be sure.
The reduction in number of places to cast votes would obviously have had an effect. Even making it a little bit harder or take a little bit longer to vote, when widespread and systematic, can potentially be politically significant.
I wonder if there’s a connection to the massive lines you heard about on election day, though I know those tended to happen in cities. Was the reduction in voting stations spread evenly geographically, concentrated in cities, or the like? It is long-established that people at the lower end of the income spectrum are more affected by having to go further or take more time off to vote.